 MIT’s Robert Weinberg, a leading cancer researcher who retracted a Cancer Cell paper earlier this year for “inappropriate presentation” of figures, has corrected a different paper in the same journal.
Here’s the correction for “Species- and Cell Type-Specific Requirements for Cellular Transformation:”
We were apprised recently of errors made in the assembly of Figures 2B, 3A, 4A, 4B, and 5G, resulting in the incorporation of incorrect representative images in these figures. These errors occurred during the electronic assembly and have no bearing on the conclusions of the study. The corrected figures are shown below. The authors apologize for any possible confusion this might have caused.
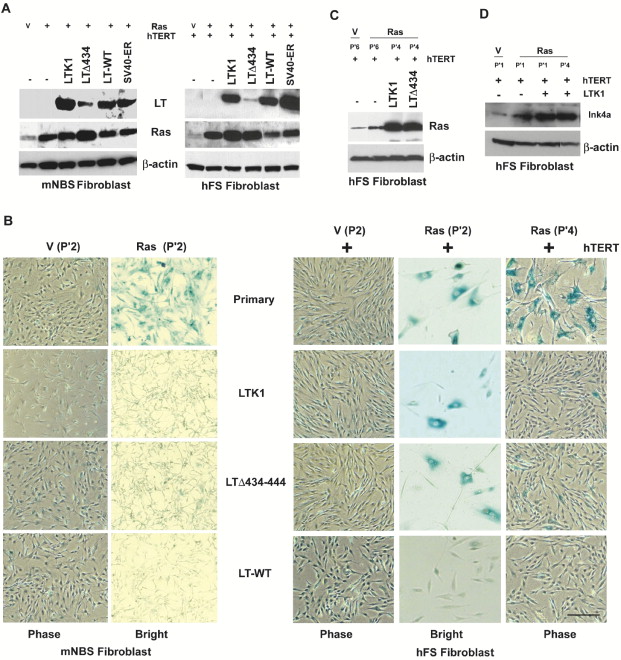
Here’s the original Figure 2 and caption, followed by the new version (read all the way to the end of the post for more details on how this came to light):

The rest of the original figures can be seen here without a paywall, while the new ones are in the correction. The paper has been cited 263 times, according to Thomson Scientific’s Web of Knowledge.
We asked Weinberg how the errors came to the team’s attention:
As I recall, there was a person (identity unknown to me) who trolls through the literature looking for places where there are indications of error. S/he studied this paper and correctly discovered that there were certain details of several of the figures that just did not make sense. We were apprised of this discovery (I forget whether it was from the journal or indirectly from this individual), and so we (largely the first author) went through the published paper and sure enough confirmed that there were errors in the details of several of the figures, which confirmation we apprised the journal of. We then requested that we publish an erratum to correct these errors. While they did not affect the overall conclusions of the paper, they were nevertheless errors, and the journal agreed to allow the publication of these errata. Anapoorni Rangarajan then proceeded to describe in detail how these errata arose and how the figures should have correctly been published, which is what you have now seen.
The person unknown was more than likely Clare Francis, who sent Cell an email on January 17 of this year — three days after the Cancer Cell retraction notice appeared — describing a number of potential issues in the paper. Questions have also been raised on PubPeer.
Perhaps there might be explanations of another 3 papers by the first author of Cancer Cell, Volume 6, Issue 2, 171-183, 1 August 2004.
1. The EMBO Journal (2001) 20, 3427 – 3436
http://pubpeer.com/publications/11432830
2. J. Virol. August 2004 vol. 78 no. 16 8687-8700
http://pubpeer.com/publications/15280477
3. J. Virol. September 2009 vol. 83 no. 17 8565-8574
http://pubpeer.com/publications/19515765
good catch! The first author is a prestigious Wellcome scholarship holder at the moment! and leading a lab of a dozen students…
I don’t like how the “whistle-blower” was called a troll…..sounds like somebody may need a break from the D.Stapel spin class, and instead may benefit from a ride on the TED train……
“trolls” — it’s a verb, “to search through (something)” is one definition from the Merriam-Webster website. The word may have been used innocently. It carries connotations of fishing. It’s not the most common way to describe what was done in this case, but it seems possible that the word wasn’t used by Weinberg to be critical.
Must be a US use. UK Troll is a.. …Troll, though we do indeed “trawl” to fish.
Interesting that someone “trolling” can see things that are missed by the senior author, the reviewers and the editors. My guess is that is because Clare Francis is the only one to actually looking at the figures.
It seems some papers are accepted for publication in prestigious journals based on the fame of the authors and their affiliation, rather than the on the scientific quality of the data, which is, apparently, irrelevant, even for corrections.
Would this paper have been published in Cancer Cell if Robert A. Weinberg had not been an author, or the affiliation had been with the Tata Institute of Fundamental Research, Bangalore, rather than the Whitehead Institute for Biomedical Research?
It is time for double-blind peer review, where manuscripts are judged on their scientific content, rather than who the authors are, or where they come from.
The use of trolling bothers me. We are peers in the scientific community, and our function is to critically review/analyze original works of scientific literature. I do not believe any of us purposely set out to look for – or troll as some would put it – for errors/dodgey data, which I feel was implied by that statement.
if the former supervisor supports it might be possible to publish papers from Bangalore as well, I guess…
Yikes…take a look at the high-res corrected version of Figure 2 (http://www.cell.com/cancer-cell/image/S1535-6108%2813%2900374-7?imageId=gr1&imageType=hiRes). The right-hand “LT” blot in panel A has very obvious signs of splicing (notice the first lane is shifted up compared to the rest of the lanes). Other blots have straight vertical lines that are also indicative of splicing…
The p’4 lnk4a band is definitely pasted (panel D). So is the actin band. ouch.
The “corrected” Fig. 5 parts D and E appear to be more collage than Western blot.
I am not a specialist in blots or gels. But I see alot of papers in my field of study that appear to have symptoms of what you describe, i.e., lanes from different or separate gels whose individual lanes have been cut and added together. Is this the official definition of splicing? If so, where does it indicate in any Instructions to Authors of any journal that splicing (specifically) is fraud? For the amateurs in gels on this blog, can someone please provide a full set of definitions about what exactly the term “figure manipulation” actually involves apart from the obvious duplication. If there are published papers on exact defintions, then these would also be welcomed. I think those of us who are not specialists in gels, blots, etc. could benefit from the experts here on this topic. After all, some of us also like to “troll” through paper sin our fields of study, and if we have some additional training and and professional advice, this would help alot. There are alot, I repeat, alot of papers in my field that appear to have “splicing”. Especially earlier papers. On a practical level, how about papers let’s say before 2000, or in the late 1980’s, where molecular techniques were still a little rough around the edges. I assume that the costs of running perfect gels would have been high and that “splicing” would have been quite common, simply because techniques had not yet evolved. I would really appreciate some input from regular bloggers like “Fernando Pessoa”, “Ferniglab” and “Ressgi Integrity” (and others) who appear to provide the greatest critical analyses of gels and figures.
JATdS wrote “where does it indicate in any Instructions to Authors of any journal that splicing (specifically) is fraud?” Please have a look at:
J Cell Biol. 2004 Jul 5;166(1):11-5.
What’s in a picture? The temptation of image manipulation.
Rossner M, Yamada KM.
PMID:15240566
PMCID:PMC217214
Thanks Michael.
I’m do not have scientific expertise in this area, however the corresponding author’s response in his statement was to correct the errors in the original paper. This implies to me that whatever they had in the original paper could be considered erroneous/unacceptable in their field.
I think what is most shocking is Weinberg says that these mistakes have no bearing on the conclusions of the paper. At what point in your career as a scientist where precision and accuracy are paramount do you claim that it doenst affect the conclusions. you make a hypothesis, you test that hypothesis, then you make a conclusion. If there are errors in the tests ie the experiments then you cant conclude a thing! Errors in hypothesis testing must lead you to accept only the null hypothesis. Do your moral/intellectual gymnastics all day long. Karl Popper would have a field day.
The statement “incorporation of incorrect representative images in these figures” is strange, when you think about it.
Why would the data be spliced in the first instance? The first set of data presented to the PI/lab meeting may well be on multiple blots from different experiments. Conclusion: excitement, because there may be a signal. Next stage, design experiment, to see if signal holds up when appropriate samples are analysed on the same gel. Signal still holds? Tweak experiment design and gather technical and biological repeat data.
The preliminary data, which might indeed include a montage in powerpoint for a lab meeting, to highlight the potential signal, shouldn’t be anywhere near the electronic submission process. At the least these preliminary data would be in a different sub directory. I like mechanisms. So what might be the mechanism whereby such preliminary data would be incorporated into a submitted manuscript?
Interesting that there seem to be problems with the corrected figures.
Maybe a correction of the correction is required?
In any event, I like “incorporation of incorrect representative images in these figures” and believe it could well make it into the thesaurus of euphemisms, http://ferniglab.wordpress.com/2013/05/05/thesaurus-of-euphemisms/
In due course, if this thesaurus becomes a volume of sufficient weight, it might even make it to the IgNobels (#IgNobel) – the 2013 ceremony is on later today.
For Cell. 2004 Jun 25;117(7):927-39.
http://www.ncbi.nlm.nih.gov/pubmed/15210113
a paper by the same senior and corresponding author as Cancer Cell, Volume 6, Issue 2, 171-183, 1 August 2004 there are these comments on Pubpeer:
http://pubpeer.com/publications/15210113
One extra observation.
Figure 6D. Fibronectin panel. Vertical, straight change in background between left and middle lanes.
For JATds
“I assume that the costs of running perfect gels would have been high and that “splicing” would have been quite common, simply because techniques had not yet evolved”
The problem is fairly simple. Splicing is any time someone makes two sample appear to have been run side by side, when in fact they were not. It normally shows up as sharp edges or lines between lanes, sharp background changes etc.
If the two samples are NOT run together (on the same gel), this MUST be indicated by a white break between the lanes.
Splicing, manipulating images to make them seem to have been run together, is not, and never has been an acceptable practice.
PWK, this is great. My understanding is now starting to advance. But your simply described definition will help ALOT of scientists who were probably not even aware that what they were doing was unethical. Wow, a truck-load of work ahead screening literally thousands of papers ion my field of study…
I would have thought more care would be taken to avoid such errors. Especially since Weinberg’s own career was in danger due to the Spandidos fraud case back in the day of oncogene detection.
http://articles.chicagotribune.com/1996-10-07/business/9610070181_1_oncogenes-natalie-angier-nobel-prize
Spandidos was sacked, but ironically runs a number of cancer journals these days, I believe.
Prompted by: Pete September 13, 2013 at 3:53 am
The Chicago Tribune article refers to Demetrios Spandidos who was in Toronto, and the comment mentions that he runs a number of cancer journals.
These journals
http://www.spandidos-publications.com/home
http://www.spandidos-publications.com/pages/contact
mentions Professor D.A. Spandidos
The C.V. fits with Toronto.
http://virology.med.uoc.gr/cv.html
Demetrios A Spandidos is author on
Mol Cancer Ther. 2007 Apr;6(4):1387-99.
Chemotherapeutic drugs sensitize cancer cells to TRAIL-mediated apoptosis: up-regulation of DR5 and inhibition of Yin Yang 1. Baritaki S, Huerta-Yepez S, Sakai T, Spandidos DA, Bonavida B.
http://www.ncbi.nlm.nih.gov/pubmed/17431117
Figure 3.
http://mct.aacrjournals.org/content/6/4/1387/F3.large.jpg
Figure 3A. Vincristine (0.05 microgram/ml). Beta-actin panel. Vertical change in signal/step in level of bands between lanes 2 and 3.
Vincristine (0.1 microgram/ml). DR5 panel. Vertical, straight, dark streak between lanes 2 and 3.
Please compare lanes 2,3,4 and 5 beta-actin panel Untreated cells figure 3A with lanes 1,2,3 and 4 Vincristine (0.1 microgram/ml) figure 3A.
Figure 3B. VP-16 (10microgram/ml). Beta-actin panel. Vertical, straight streak below left end of band in lane 2. Vertical change in background below left end of lane 2.
Please compare lanes 2,3 and 4 beta-actin panel VP-16 (5 microgram/ml) figure 3B with lanes 1,2 and 3 beta-actin panel VP (15 microgram/ml) figure 3B.
Please compare lanes 3 and 4 beta-actin panel VP-16 (10 microgram/ml) figure 3B with lanes 3 and 4 beta-actin panel Vincristine (0.1 microgram/ml) figure 3A and with lanes 4 and 5 beta-actin panel Untreated cells figure 3A.
Figure 3C. CDDP (1 microgram/ml) DR5 panel. Vertical changes in background between lanes 1,2,3 and 4.
CDDP (3 microgram/ml) DR5 panel. Vertical changes in background between lanes 1,2 and 3 and 4.
CDDP (5 microgram/ml) DR5 panel. Vertical changes in background between lanes 1,2,3 and 4.
Please compare bands lanes 2,3 and 4 beta-actin panel CDDP (1 microgram/ml) with bands lanes 1,2 and 3 beta-actin panel CDDP (3 microgram/ml).
Figure 3D. ADR (0.25 microgram/ml). DR5 panel. Vertical, straight, grey streaks between lanes 2,3 and 4.
ADR (1 microgram/ml). DR5 panel. Vertical changes in background between lanes 1,2,3 and 4.
Please compare beta-actin panel ADR (1 microgram/ml) figure 3D with beta-actin panel Vincristine (0.01 microgram/ml) figure 3A.
Figure 4.
http://mct.aacrjournals.org/content/6/4/1387/F4.large.jpg
Please compare bands lanes 1,2 and 3 beta-actin panel ADR (0.25 microgram/ml) figure 4B with bands lanes 2,3 and 4 beta-actin panel ADR (0.5 microgram/ml) figure 4B.
Please compare bands lanes 1,2 and 3 beta-actin panel ADR (0.50 microgram/ml) figure 4B with bands lanes 1, 2 and 3 beta-actin panel ADR (1 microgram/ml) figure 4B.
Please compare bands lanes 3,4 and 5 beta-actin panel Untreated cells figure 4A with bands lanes 1,2 and 3 beta-actin panel ADR (0.05 and 1 microgram/ml) figure 4B.
Robert Weinberg is too big to fail. As I recall, at the time of the last retraction I amongst many others identified many incidences of potential gel splicing in the 2003-2008 period, but it appears that Cancer Cell is the only journal that takes it seriously. I don’t recall spotting any problems after 2008, but that may just mean his group’s “anomalies” are no longer visible to the naked eye.
A few months ago I spotted Robert Weinberg’s name in the few annual reports of the Special Virus Cancer Program of the 1960s and 1970s that I have managed to find. These annual reports seem to be very difficult to find these days indeed – although I haven’t tried very hard to track them down (it is on my list). Now if there was ever a case of a scientific enterprise too big to fail, that is one. Although of course 99% of the names mentioned in those annual reports would have had no involvement – and that would almost certainly include Prof. Weinberg.
Does the paper say a figure contain samples from different gels? The techniques can be different, composed figures can be meaningful (say, if marker is present, etc.) However, if paper does not say this, and the reader can take two gels as one, figures are deception.
Ivan,
Isn’t one of these figure 2 both the same?
I think you are displaying the corrected figure twice. It would be great if you could get the original as I don’t think Cancer Cell are displaying it any more.
All these figure sleuths commenting here and nobody noticed 😉
Scrutineer said “Isn’t one of these figure 2 both the same?”
No, one is the original, and one is corrected, it is just that they “corrected” the duplicated pictures of the cells (e.g the duplicated LTK1 and LTdelta434-444 mNBS fibroblast Bright panels), but they did not correct the photoshopped Westerns.
Reply to michaelhbriggs September 18, 2013 at 7:47 am
It is better than Sodoku. I stand to be corrected.
The Ras (P’2) LTdelta434-444 panels are different.
I recently was made aware of a number of errors that were made in the assembly of the statement above. The inappropriate assertion did not and does not fall within the bounds of acceptable scientific practice. Accordingly, I am retracting the statement in its entirety. I apologize for any inconvenience this may have caused.
Reply Scrutineer September 19, 2013 at 3:53 am
Even more droll. It was a mind-bending Sodoku puzzle though, which I failed too.
Thanks for drawing attention to the wording of the retraction notice.
Reply to Scrutineer September 18, 2013 at 3:55 am
Very droll. You quite right.
I was paying attention to the things in the corrected version (here are high definition versions in the publisher’s retraction notice) which do not seem quite right.
Freeloader September 12, 2013 at 11:20 am
Arthur September 12, 2013 at 11:41 am
and michaelhbriggs September 12, 2013 at 8:35 pm
picked on some of them.
I still don’t see the difference between the figures. I agree that “western-blot-collages” should be forbidden. What about unspecific binding or binding to modificated proteins, crappy antibodies?